- Courses
- Tutorials
- Jobs
- Practice
- Contests
Interview Preparation
- Interview Preparation For Software Developers
- Must Coding Questions - Company-wise
- Must Do Coding Questions - Topic-wise
- Company-wise Practice Problems
- Company Preparation
- Competitive Programming
- Software Design-Patterns
- Company-wise Interview Experience
- Experienced - Interview Experiences
- Internship - Interview Experiences
Commerce
- Commerce
- Class 11 Accountancy Notes
- Class 12 Accountancy Notes
- Accountancy
- Class 11 Business Studies Notes
- Class 12 Business Studies Notes
- Business Studies
- Class 11 Microeconomics Notes
- Class 11 Statistics For Economics Notes
- Class 12 Macroeconomics Notes
- Class 12 Indian Economic Development Notes
- Economics
- Management
- Income Tax
- Finance
Aptitude | Data Interpretation | Question 6
Study the following table carefully and answer the questions given below it:
Number of Different categories of vehicles sold in the country over the years (in thousands)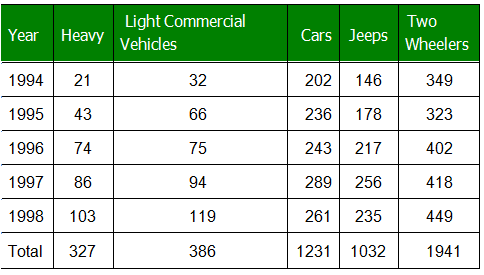
Answer question 6-10 based on data from above table In which of the following years was the number of light commercial vehicles sold approximately 25% of the number of 2-wheelers sold?
Number of Different categories of vehicles sold in the country over the years (in thousands)
Answer question 6-10 based on data from above table In which of the following years was the number of light commercial vehicles sold approximately 25% of the number of 2-wheelers sold?
(A)
1994
(B)
1998
(C)
1996
(D)
1997
Answer
Please comment below if you find anything wrong in the above post
Feeling lost in the world of random DSA topics, wasting time without progress? It's time for a change! Join our DSA course, where we'll guide you on an exciting journey to master DSA efficiently and on schedule.
Ready to dive in? Explore our Free Demo Content and join our DSA course, trusted by over 100,000 geeks!
Last Updated :
Share your thoughts in the comments

GeeksforGeeks